

Getting to know yourself
"To know thyself is the beginning of wisdom." This famous quote is often attributed to Socrates. Your newfound wisdom begins with knowing your business and how it operates. I know what you’re thinking, “Hey, I know my business through and through. No one knows it better than me”. Even if that’s correct, you still may not be seeing what you need to see.
To know thyself is the beginning of wisdom
Standard business documentation
You’d be shocked at how quickly some business owners get sidetracked. They can quickly chase shiny things that in the end don’t jive with who they are. This is as simple as the following: take your core values, your target persona, your mission statement, and print them out. Once printed, keep them by you while you go through this insights journey. You’ll be thankful that you did.
Asking staff and clients
One thing to always remember, many minds are better than one. A fresh perspective could be all it takes to let you see things a bit different. If you ask a handful of staff or clients just a few questions, they could be lighting the path to data insights for you. These questions could include:
- What do you think our biggest pain point is?
- What are we known for?
- What are we the best at?
- What could we improve on the most?

Feedback is critical
In one example, a client had the impression that their audience was mostly at a desk all day, looking at their website on a computer. They decided that they needed to improve the desktop experience. Luckily, before embarking on a massive campaign, they asked around and actually got some negative feedback regarding the mobile experience. It turns out that the desktop experience was good, but the mobile experience was lacking. Just by talking to people, they were led to look in the right place.
What software should you use for this?
This is a very minor thing to worry about. In fact, I’ve seen businesses get by on pure email alone (not recommended). A simple tool could be a spreadsheet, such as in Google Drive. If you want the best results, use a survey tool. Google Forms works well here, and Survey Monkey was built for this.
Centralize your data
Once you know who you are and what data you would like to mine, it’s time to centralize your data. You may have data that is all over the place, and you need to bring it to a central location.
For example, let’s say you run a successful e-commerce business. You’ve decided to look for insights based on product performance. You could have product performance data in Google Analytics, e-Commerce sales dashboards, shipping and inventory management software, and your CRM. What you need to do is to aggregate that data and tie everything together to the products.
This is often where businesses get tripped up. It’s tricky, cumbersome and laborious to get all of this data into one place, and have all of the data points associated with each other. There are a couple of software suites that assist with this. Microsoft Power BI and Google Data Studio work great for compiling data. Pro tip: Make sure you associate the data points for powerful results.
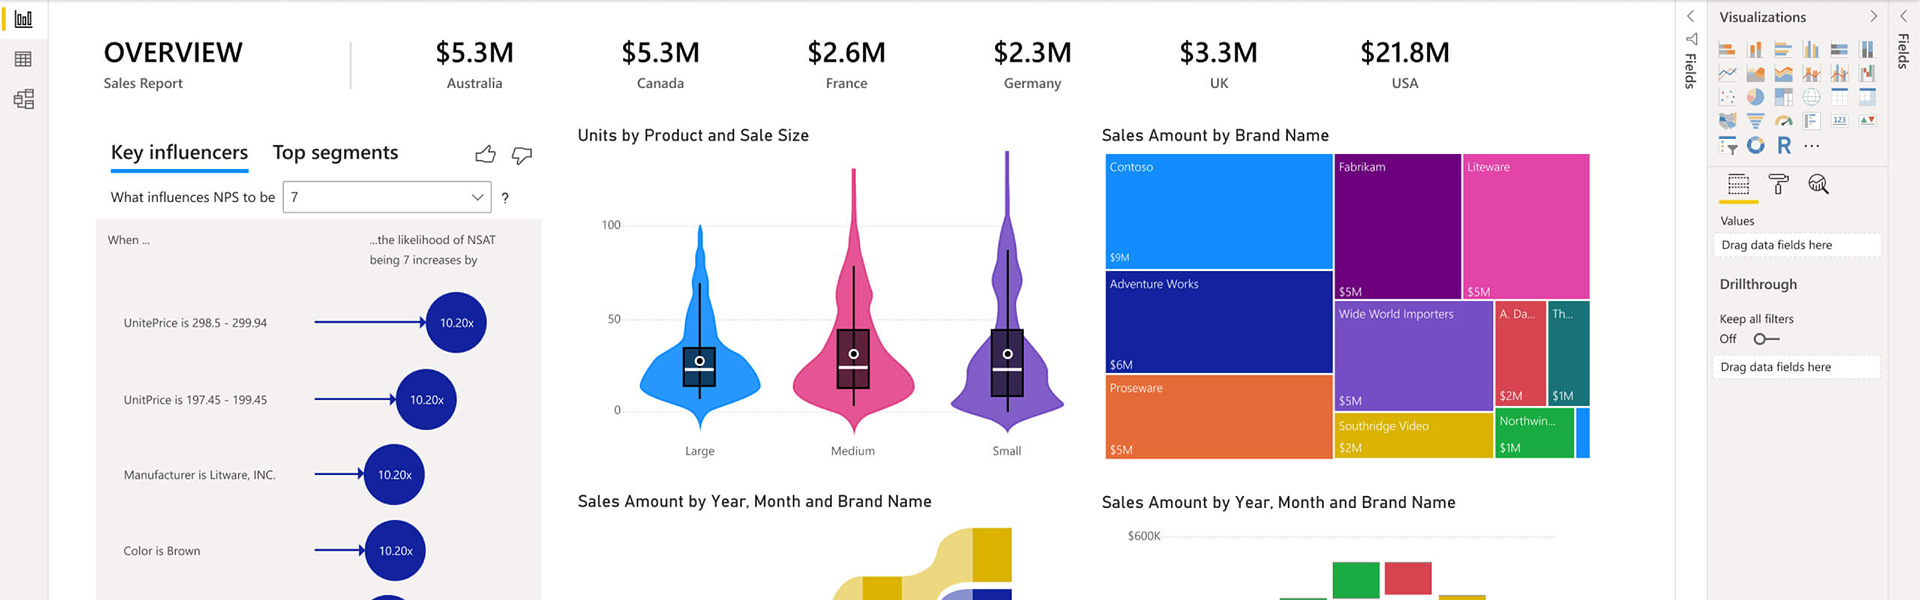 PowerBI allows you to aggregate data from many sources
Dive deeper and discover pain points
Now that you have your data in one central place, you need to mine it for insights. One way to get insights from data is to analyze the pain points. A key thing to remember is not to go too vague.
Wishing to bring in more revenue isn’t a pain point. Instead, you could decide to find product categories that have a much lower average score on customer reviews.
This approach could find insights such as:
- Your marketing campaign is driving the wrong customer base to your poor performing products
- Your data is skewed since it’s such a small sample size
- You discover customers aren’t presented an opportunity to leave a good review on poor performing products
- Your other product campaigns have a successful social media campaign backing them up
- The other products come with a physical instruction manual. These are digital.
You can see where this is going. But by looking at the pain points, you can quickly alleviate the obvious pain points that you may have.
Dive deeper and discover successes
Finding and fixing pain points is a great and obvious way to gain valuable insights from your data. One avenue often overlooked is looking at your positive results for data insights. This is where you can really gain some traction.
It’s the equivalent to wanting everything to be as successful as your bright and shining star. In a similar mindset, find what works for you and figure out why that is.
This approach could find insights such as:
- Your most profitable product ranks 5th organically for a high traffic search term
- The pagespeed on your most profitable product is 30% higher than the rest of your products
- The YouTube video associated with your highest selling product has 50x more visits than your other product videos
- The product with the best ratings had a 30% faster average shipping time
Once again, these are just examples. By viewing what’s going well, you may be able to find more opportunities through your data insights.
Find the anomaly
If you’re not sure what pain point or success to try and navigate, don’t worry. You’re not alone. If this is the case, don’t worry. We have a backup plan for you.
Sometimes, when you are digging for insights from data, you have to experiment. You may often find results to be inconclusive. But there is one thing to keep your eye out for, and that is the anomaly. Your anomaly should stick out from the rest of your data like a sore thumb. This is where you want to figure out what is driving the anomaly. Keep in mind, it may not be what you think.
An anomaly has his own ambitions. You can try reasoning with him, but that's like using money to bribe a beast.
For example, if you pull in all of your website’s data, you should be able to see pagespeed performance on a page by page basis. What if you plot a graph, and you see on average your pages load in 1.5 seconds, but you have one page that loads in 12 seconds? That is an anomaly. In this case, your anomaly helps you see that you have an underperforming page, which could affect search rankings, product performance, or many other factors.
Long story short, take your data and plot it out in all different kinds of graphs. As soon as you see an anomaly, investigate it. This is a quick and effective way to gain insights from data.
Create your action plan
Once you have the insights you need from your data, what do you do? We’ve seen businesses create some pretty graphs, dive into the data, and find some insights -- and still manage to drop the ball. Creating the correct action plan is paramount for business success.
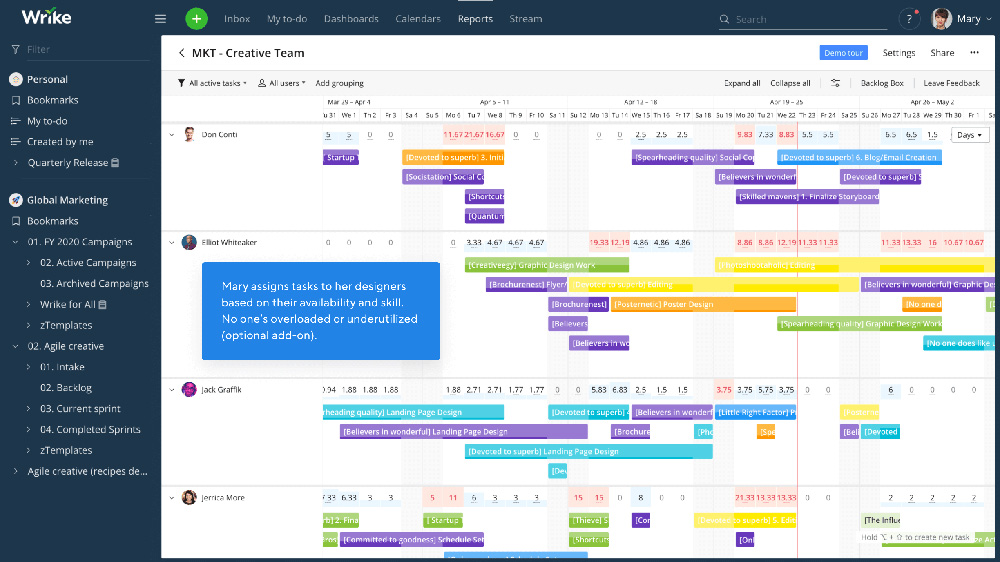
The first thing we recommend is to do is to utilize a project management system. There are many options out there, like Wrike, Asana and Trello. Our agency uses Wrike currently, and has since 2014. A project management system will allow you to assign employees tasks, keep a schedule and stay on track.
Once you have your project management system setup, it’s time to take action. This is where experience comes into play. You may have found this gem of an insight, but what do you do with it? An experienced agency or professional will know how to tackle that insight. Align yourself with the right people, create a project in your project management system, and watch your insight deliver business success.
Are you ready for a data-driven action plan?